Charts
An excellent way to provide feedback to a user is by showing them charts of the data they have collected and reference data.
Note
Adding a Charts
Set the question type to: chart
Put the data in the calculation column.
Optionally specify the following parameters:
chart_type=horizontal_bar.  Will show the data as a horizontal bar chart. The default is a line chart
stacked=yes.  Use with horizontal_bar charts to stack the bars.
Chart Data
The chart data is specified in the calculation column. You can use text functions such as join() to combine answers from questions, or values pulled from a CSV file into the correct format.
The rules for constructing data and labels are as follows:
Data points are seperated by a single colon (:)
X Axis Labels are separated by a single colon (:)
Data is separated from labels using double equals (==) Note the labels are placed first.
Multiple datasets are separated using double colon (::). Each dataset is shown as a line on a line chart, hence you can have multiple lines.
Labels for data sets are separated from X Axis labels using double colon (::) Note the X Axis Labels come before data set labels.
Optionally the X axis numbers can be added to the data. This can be useful when showing multiple datasets if one of the data sets has missing data points. Or even in a single dataset if some of the data points are missing and you want this to be apparent on the chart. To do this separate the X Axis number from the value using hash (#). The X Axis number comes first. Start the X axis numbers from 0.
For example:
The second data set does not have a value for the 2nd point in the series (X axis number 1)::
0#10:1#20:2#30:3#40::0#5:2#7:3#8
Example 1 - Simple Line Chart
Calculation:
join(':', '1','2','3','2')
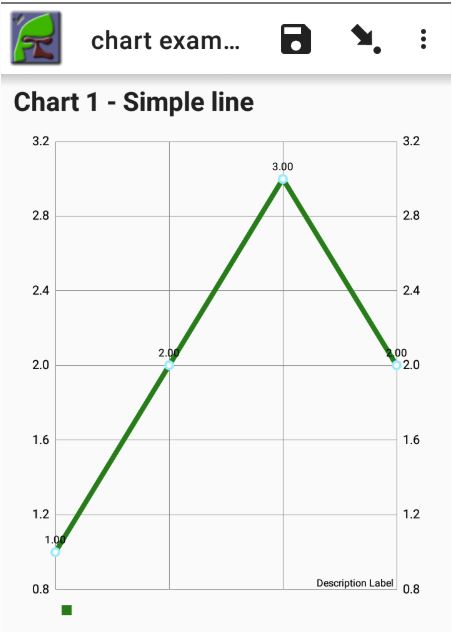
Simple Line Chart
Example 2 - Line Chart with X Axis Labels
In this example the data values are first combined with a colon separator. Then the X Axis labels are combined again using a colon separator. Finally the data is combined with the labels using the double equals separator.
Calculation:
data:                 join(':', '26','12','34','45')
labels:               join(':', 'A', 'B', 'C', 'D')
chart calculation:    join('==', ${labels}, ${data})
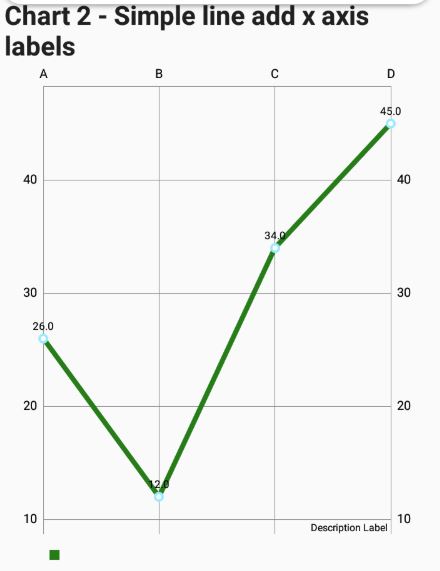
Line Chart with X Axis Labels
Example 3 - Two Lines with X Axis Labels
To show two lines that means showing two data sets. The data is created in stages. First one data set is created by combining the data values with a colon separator. Then the second data set is created in the same way. Then these two data sets are combined using a double colon to separate them.
Calculation:
dataset_1:            join(':', '26','12','34','45')
dataset_2:            join(':', '48','36','48')
combined_data:        join('::', ${dataset_1}, ${dataset_2})
labels:               join(':', 'A','B','C','D')
chart calculation:    join('==', ${labels}, ${combined_data})
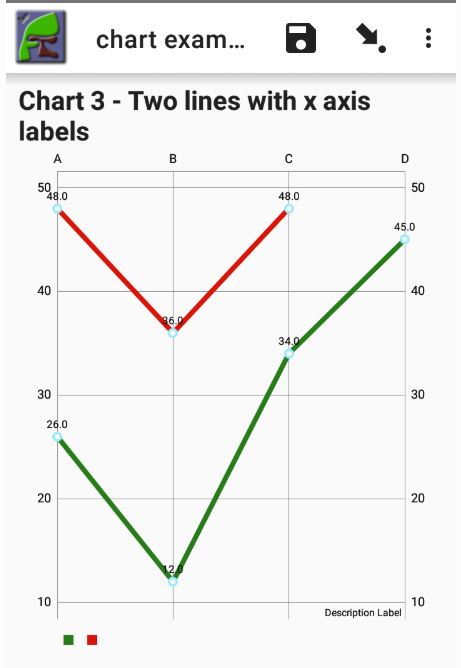
Two Lines with X Axis Labels
Example 4 - Two Lines with X Axis and Data Labels
Now we are adding labels for each of the datasets. In this example the X axis position of each data point is also made explicit using the # character. This is used because the 2nd data point in the second data set is missing.
Calculation:
dataset_1:            join(':', '0#26','1#12','2#44','3#45')
dataset_2:            join(':', '0#48','1#46','2#12','3#48')
combined_data:        join('::', ${dataset_1}, ${dataset_2})
x_labels:             join(':', 'A','B','C','D')
data_labels:          join(':','First Line', 'Second Line')
combined_labels:      join('::', ${x_labels}, ${data_labels})
chart calculation:    join('==', ${combined_labels}, ${combined_data})
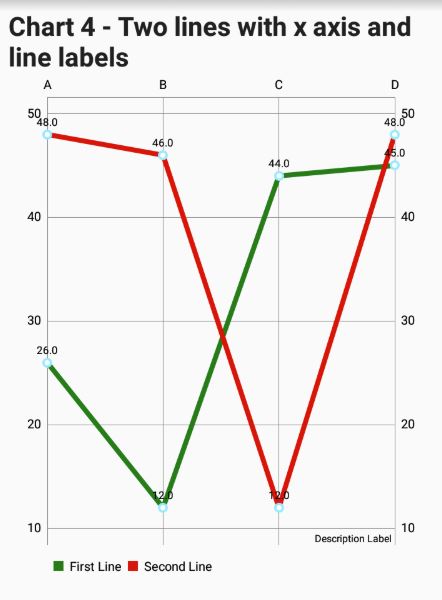
Two Lines with X Axis and Data Labels
Example 5 - Simple Stacked Horizontal Bar Chart
Parameters:
chart_type=horizontal_bar
stacked=yes
Calculation:
chart calculation: join(':','1','2','3','4','5','6','7')
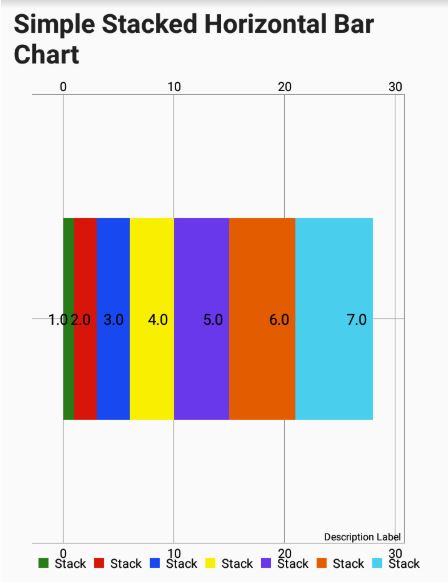
Simple Stacked Horizontal Bar Chart
Example 6 - Stacked Horizontal Bar Chart with X Labels
Parameters:
chart_type=horizontal_bar
stacked=yes
Calculation:
data:                 join(':', '1','2','3','4')
labels:               join(':', 'A','B','C','D')
chart_calculation:    join('==', ${labels}, ${data})
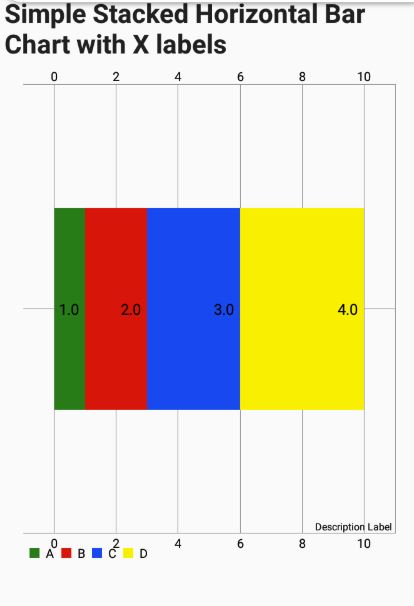
Stacked Horizontal Bar Chart with X Labels
Example 7 - Stacked Horizontal Bar Chart with 2 data sets
Parameters:
chart_type=horizontal_bar
stacked=yes
Calculation:
dataset1:                 join(':', '1','2','3','4')
dataset2:                 join(':', '4','3','2','1')
combined_data:            join('::', ${dataset1}, ${dataset2})
x_labels:                 join(':', 'A','B','C','D')
data_labels:              join(':', 'First Bar', 'Second Bar')
combined_labels:          join('::', ${x_labels}, ${data_labels})
chart_calculation:        join('==', ${combined_labels}, ${combined_data})
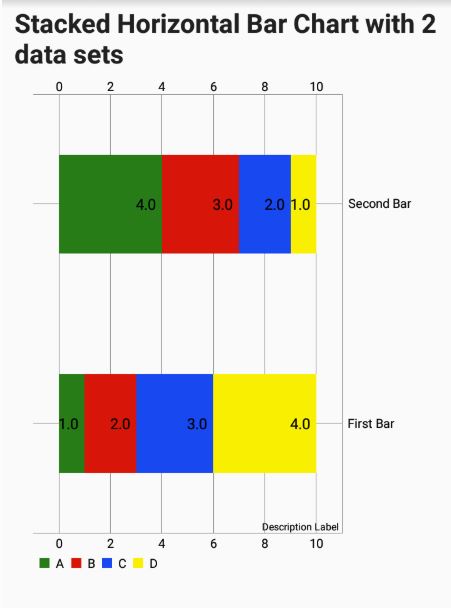
Stacked Horizontal Bar Chart with 2 data sets
Example 8 - Simple Horizontal Bar Chart
Parameters:
chart_type=horizontal_bar
Calculation:
chart_calculation: join(':', '1','2','3','4','5','6','7')
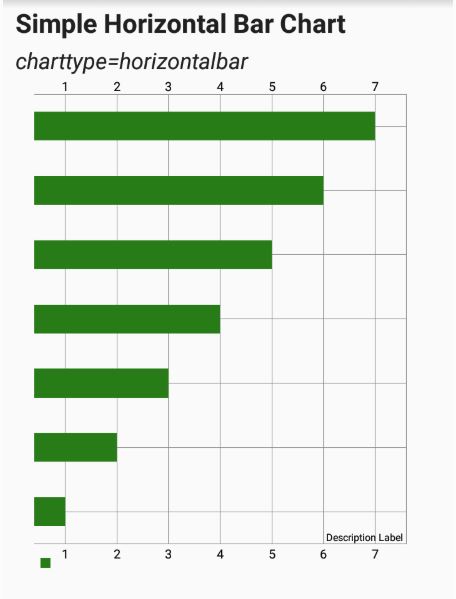
Simple Horizontal Bar Chart
Example 9 - Horizontal Bar Chart with X Axis Labels
Parameters:
chart_type=horizontal_bar
Calculation:
data:                 join(':', '1','2','3','4')
labels:               join(':', 'A','B','C','D')
chart_calculation:    join('==', ${labels}, ${data})
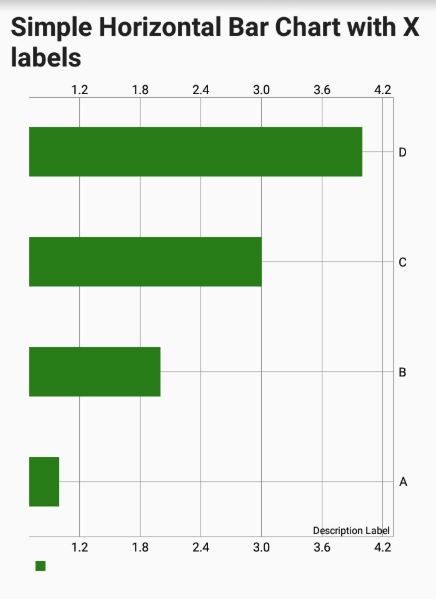
Horizontal Bar Chart with X Axis Labels
Example 10 - Grouped Horizontal Bar Chart with Labels
Parameters:
chart_type=horizontal_bar
Calculation:
dataset_1:            join(':', '1','2','3','4')
dataset_2:            join(':', '4','4','2','1')
combined_data:        join('::', ${dataset_1}, ${dataset_2})
x_labels:             join(':', 'A','B','C','D')
data_labels:          join(':', 'First Group', 'Second Group')
combined_labels:      join('::', ${x_labels}, ${data_labels})
chart_calculation:    join('==', ${combined_labels}, ${combined_data})
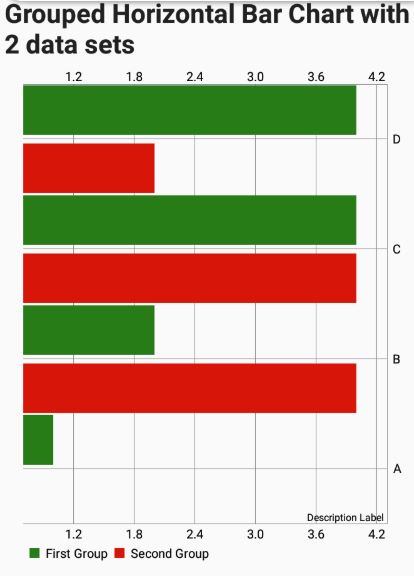
Grouped Horizontal Bar Chart with Labels